
Context: LLM transcript for the vizualization piece of RoomSenseIQ Revisited. The firmware half is here.
Agent: Hermes Agent on a Raspberry Pi 4, over Discord.
Model: deepseek-v4.1-flash (Nous Research).
An edited transcript of one session, picked up straight after the firmware work. My prompts are verbatim; the agent’s replies are condensed. I cut its reasoning and most raw tool output, but the findings, numbers and commands are as they came out. The screenshots are the ones the session actually produced, so they show the state of the house that day, including the unit that was offline.
1. “Is there a way to visualize what they see?” #
gabe: For those motion sensors (mm wave radar I think) is there a way to visualize what they see?
Hermes: [reads the firmware’s LD2410 component and the dashboard’s own JavaScript, probes one unit over its websocket, then:]
Yes, and here’s your foyer unit right now, plus one I just built.
What these actually “see”
The LD2410 is a single-beam 24 GHz Doppler radar. No camera, no point cloud, no angle. What it measures is energy per range gate along one beam: 9 gates x 0.75 m = 0-6.75 m, twice over (one profile for moving targets, one for static). So “visualize what it sees” means a 1-D range profile, not a map.
Already built in, zero work
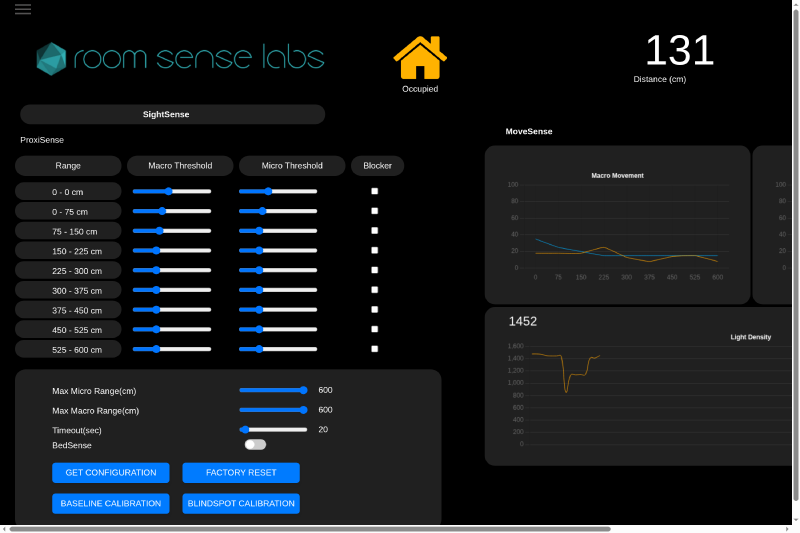
Every unit serves the vendor’s own SightSense dashboard at
http://192.168.1.25/dashboard.html(and .26/.27/.28). It plots Macro Movement vs range with your per-gate thresholds, live over a websocket. That’s the picture below. Line chart, updates about 1 Hz.
What I added
Same data, but as a waterfall, so you can see motion sweep through the gates over time.
radar-view.pytalks tows://<ip>/ws, samples every second and renders a PNG. Captured all four units for 60 s:
- Foyer: static energy pinned at gates 150-375 cm (energy 96/100/100/71). That’s furniture and floor, essentially frozen. Moving energy low-key everywhere, distance 253 cm, Occupied.
- Office / Living Room / Bedroom: nearly empty profiles, distances 234/449/131 cm.
- Gate 0-75 cm reads 0 on every unit. That’s the radar’s own near blind spot, which is what Blindspot Calibration is for.
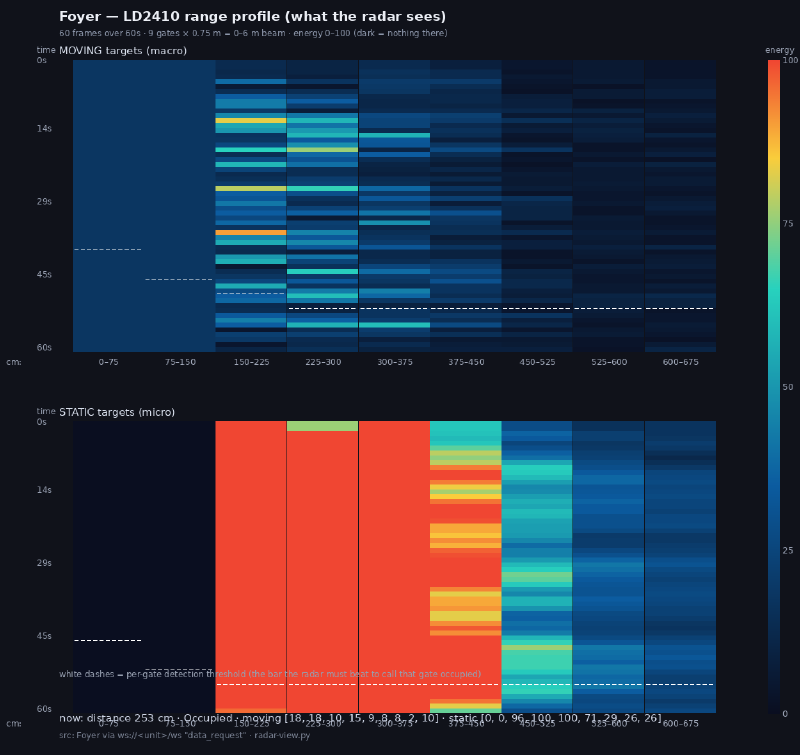
Note the dashed threshold lines read 0 on three of the four units: that array is only populated by whatever the dashboard’s sliders last pushed, and every OTA factory-resets it. Foyer has real values (35/25/20/15…).
If you want an actual 2-D “what it sees”
Not possible with the LD2410: one beam, no angle, nothing left or right. The module that can is the LD2450, same 24 GHz family, UART, tracks up to 3 targets as x/y coordinates, so you’d get a top-down floor plan on a 2-D chart. That’s a hardware swap plus a new driver (different frame format), and the ESP32-S3 side is trivial.
[What the first hour actually took: reading
ld2410.cto find that the firmware runs the module in engineering mode and keeps the 9-gate profile in shared memory, then readingdashboard_charts.jsto find how the vendor’s own page asks for it. First websocket probe: the handshake succeeded (HTTP/1.1 101 Switching Protocols) and then nothing arrived for 12 seconds, because the firmware only pushes a frame after the client sendsdata_request. With that sent, 6 frames came back carryingmacromovement,micromovement,light_density,motion_status,occ_statusanddistance.matplotlibisn’t installed on this Pi and PEP 668 refuses to install it, so the renderer was written against Pillow instead, which was already there.]
2. “How much extra data are we talking?” #
gabe: Neat! How much extra data are we talking to send that over MQTT? I have grafana plugged in to HA as well, so could visualize with that too.
Hermes: Ran the numbers off the firmware’s actual publish rates and topic format. I couldn’t subscribe to measure, because your broker refused the anonymous connection:
CONNACK rc=5.Per message, one JSON profile topic
roomsense-radar/<mac>/state= 24 B topic + 79 B payload + framing = 106 B on the wire{"d":253,"occ":1,"m":[18,18,10,15,9,8,8,2,10],"s":[0,0,96,100,100,71,29,26,26]}If you go the 18-entities route instead (one per gate, QoS 0): 630 B per tick, 5.9x more, because the topic name is repeated 18 times per update. That’s the whole reason to prefer the blob.
Daily volume per unit
- 1 Hz: 9.2 MB/day (4 units: 37 MB/day, 1.1 GB/month)
- 0.5 Hz: 4.6 MB/day (550 MB/month)
- 5 s: 1.8 MB/day (220 MB/month)
Context: your units already push ~37 MB/day each, and ~24 MB of that is the single room-presence topic at 5 Hz QoS 2 (432,000 publishes/day per unit, 4 packets each). So the profile at 1 Hz adds ~25% to current MQTT traffic; at 5 s it’s ~5% and invisible.
The wire isn’t the interesting cost, where it lands is
- HA recorder plus JSON attributes: 86,400 state rows/day/unit at 1 Hz, ~12 MB/day/unit in SQLite. 18 numeric entities would be ~1.55M rows/day/unit, far worse.
- So if this goes into HA, either publish every 5 s or use
recorder: exclude.Grafana: you’re on 13.1.9 at 192.168.1.10:3000.
- Live (best fit):
grafana-cli plugins install grafana-mqtt-datasource, subscribe straight toroomsense-radar/#on the broker. A heatmap panel is literally the waterfall I just built, live, zero storage, HA not involved at all. Caveats: MQTT v3.1.1 only, and it’s streaming-only, no history.- History: nothing on 8086 on your LAN, so that would mean adding InfluxDB (Telegraf into Influx handles wide arrays cheaply). Grafana-through-HA works but pumps the recorder.
Bonus, while I was in there: the firmware already defines 18 discovery structs (
esp_discovery_macro_move_bin0..8,micro_move_bin0..8) with working serializers. The vendor wired up the entities and never published them, which is why HA shows nothing. And the 5 Hz QoS 2 presence publish is 99% of your MQTT traffic; publishing it on change only would take a unit from 37 MB/day to under 1 MB/day.
3. “I already have Prometheus” #
gabe: So, currently HA is sending data to prometheus, so I have a bunch of stuff already graphed in grafana from my HA instance, including some of the environment values from the roomsense sensors.
Hermes: That changes the design, and mostly in your favour. I queried your Prometheus at 192.168.1.10:9090 to check the real constraints:
Your actual pipeline
homeassistantjob scrapeshttp://192.168.1.8:8123/api/prometheusevery 60 s (12 targets, all healthy)- Prometheus retention: 1 year. The HA job currently has 5,350 series
- Roomsense entities already flow through, e.g.
homeassistant_sensor_temperature_celsius{entity="sensor.roomsense_iq_foyer_temperature_c_0580"}So the binding constraint is the 60 s scrape, not the MQTT rate. Don’t publish at 1 Hz, that’s 60x more traffic for a bit-identical Grafana graph. Publish every 10-15 s so there’s a fresh value at each scrape:
- 18 entities every 10 s: 5.4 MB/day/unit (22 MB/day for all four)
- 1 JSON blob every 10 s: 0.9 MB/day/unit (3.7 MB/day)
Prometheus cost: negligible. 72 new series is +1.3% of your HA job. At a 1-minute scrape that’s 103,680 samples/day, 37.8M samples/year, ~50-75 MB/year on disk against a 1-year retention. At a 15 s scrape it’s ~200-300 MB/year.
The one real foot-gun is the HA recorder, not Prometheus. 72 entities updating every 10 s is 622k state rows/day, ~16 GB/year of SQLite. Exclude them with
recorder: exclude:. The Prometheus integration reads the live state machine, not the recorder database, so excluding costs you exactly zero graphs.One naming detail I verified on your instance: the exporter names metrics from the unit. Unitless sensors land in
homeassistant_sensor_state(your presence sensors are there now, e.g.sensor.roomsense_iq_bedroom_presence_056c = 1). So gates would show up as:homeassistant_sensor_state{entity=~"sensor.roomsense_iq_foyer_macrobin_.*"}If you’d rather have a dedicated metric name, set
unit_of_measurement: "%"on the discovery config and they land inhomeassistant_sensor_unit_percent. LD2410 “energy” is genuinely 0-100, so that isn’t a lie.Grafana heatmap: with those series, one panel does it.
homeassistant_sensor_state{entity=~"sensor.roomsense_iq_$room_macrobin_.*"}, regex-rename the gate index into agatelabel, heatmap panel with gate on Y and time on X, plus a$roomtemplate variable. That’s the waterfall I made, at 1-minute resolution, over a year of retention.Caveat: 60 s resolution shows occupancy patterns (gate 3-4 hot from 17:00 to 18:30), not a person walking. For live motion you’d want the Grafana MQTT datasource plugin (streaming only, no history) or the unit’s own
/dashboard.html.Alternative that skips HA entirely: a small
mqtt2prometheuscontainer turns the one JSON topic into 18 metrics withunit="foyer",gate="3",band="225-300cm"labels. Nicest labels, no 72 HA entities, no recorder issue. The cost is one more service to run.Unrelated but worth knowing: your units publish room-presence at 5 Hz QoS 2, which is 300 MQTT publishes for every 1 that Prometheus ever sees (432k publishes/day/unit). Publishing presence and distance on change would take a unit from ~37 MB/day to ~2 MB/day and not change a single existing graph.
4. “Can I run it in real time?” #
gabe: Can I run the vizualization you made to see changes in real time?
Hermes: Building a live one. Poller plus SSE server on the Pi, browser canvas dashboard, no external deps. [about 6 minutes later:]
Yes, it’s running: http://192.168.1.6:8765/
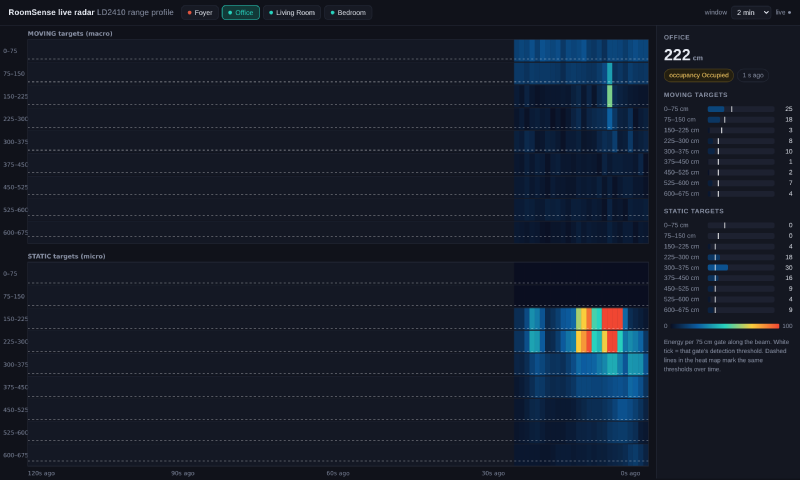
radar-live.pyis a stdlib-only poller and SSE server on the Pi. It keeps a websocket open to each unit and samples it at 1 Hz; the browser page is a canvas that scrolls the range profile in real time.
What’s on screen
- Two live waterfalls, MOVING on top and STATIC below, time flowing right to left, 9 gate rows labelled in cm
- Per-gate threshold lines drawn as you go, so you can see a gate crossing its bar
- Room buttons (Foyer / Office / Living Room / Bedroom) with a green or red dot for live vs dead, switching instantly. It backfills 10 minutes of history on switch, so you don’t wait for the chart to fill
- Right column: current distance, occupancy, and the current profile as bars with a threshold tick per gate
- Window selector (1 / 2 / 5 / 10 min), and hovering any cell gives “gate X cm, moving/static values, N s ago”
It’s installed as a service, so it survives logout and reboot:
systemctl --user status radar-live     # state
systemctl --user restart radar-live    # after editing the script
systemctl --user disable --now radar-live
journalctl --user -u radar-live -n 50  # logs
Cost: ~220 ms of CPU over the first 8 s, four tiny websocket sessions from the Pi. Nothing touches HA, MQTT or Prometheus.
Heads up: your Foyer unit is down. It stopped publishing at 08:25 this morning and its web server doesn’t answer (ICMP unreachable, ARP entry
FAILED, no HTTP on any host in the subnet, no SoftAP fallback visible). But the broker still has its socket open and HA still shows it available, which is the classic wedged-ESP32 state rather than a clean power loss. The Foyer tile shows red until it’s back; a power-cycle will fix it. Office, Living Room and Bedroom are live right now.The snapshot tool from before still works if you want a static image:
./radar-view.py 192.168.1.26 --seconds 60writes a PNG plus a profile log into~/room-sense/.[The first launch was wrong, and the screenshot showed it: canvas at 510x386,
hist: 0, and the room buttons listed only the three units that had answered, with Foyer missing rather than marked dead. Two fixes. Build the buttons from the status map instead of from the first frame that arrived, and re-fit the canvas on load and on resize with aResizeObserver. Re-captured, checked the render, and only then installed the unit file and enabled it.]
5. “Could we visualize in 2 or 3 D?” #
gabe: Hypothetically (don’t implement anything) if I put all the sensors in the same room could we visualize in 2 or 3 d?
Hermes: Short answer: 2D, maybe, crudely. 3D, no, not with LD2410s, no matter how many you stack in the room.
The fundamental problem
The LD2410 is a single-beam FMCW radar with a wide cone and no angle resolution at all. All it can ever tell you is “energy in gate N”, meaning how far along the beam, never where across it. Stack four in a room and you don’t get four views of the room, you get four 1-D range profiles that happen to point in different directions. There is no elevation channel in the hardware, so z isn’t a filtering problem, it’s absent data.
What 2D would actually look like
- Per unit, the honest render is a fan of concentric arcs (one annulus per gate, coloured by energy) drawn on the floor plan. A PPI radar display with the bearing dimension missing. Four of those overlaid is genuinely pretty: the bright arcs cross roughly where a person is.
- The math is multilateration (GPS-style, range only). It works, but the error budget is poor:
- 0.75 m gate quantization on every range
- the reported “distance” is one scalar for the whole beam, fine for one person and ambiguous with two (data association)
- a wide beam means the same person smears across several gates, killing cross-range
- wall multipath makes ghost ranges
- the static profile is dominated by furniture, so the room’s clutter is your baseline noise
- Realistic outcome with 4 units and one occupant: 0.5-1.5 m, good enough for “which zone of the room” (sofa vs doorway), not for a dot on a map. It degrades fast with two people, pets, or a room full of furniture.
- One genuine lever: the LD2410 supports a 0.2 m gate resolution mode (
SET_DISTANCE_RESOLUTION = 0x00AA), which is 3.75x finer ranging. Your firmware never issues it (default 0.75 m), so it’s untapped. That would tighten 2D multilateration noticeably without new hardware.- Practical caveat: co-located 24 GHz FMCW radars do mutually interfere (same band, uncoordinated sweeps). It works, but expect noisier thresholds and more re-tuning on every unit.
3D needs different silicon
- LD2450 (~$6-10, same 24 GHz family): real X/Y per target, up to 3 targets, 10 Hz, ~75 mm resolution. True 2D tracking with no fusion math, but still no z. It’s a tracker though: weak at static presence past ~2 m, so it complements the LD2410s rather than replacing them.
- 60 GHz MIMO boards such as the TI IWR6843ISK (~$150) or Infineon/Seeed 60 GHz modules: real 3D point clouds at 10-20 Hz, dozens to thousands of points per frame. People appear as actual blobs you can rotate in 3D. That’s what you’re picturing, and it’s a different project: new hardware, new host budget, point-cloud rendering.
The one-liner version: with what’s already on the shelves you could build an honest, coarse 2D occupancy overlay. Pretty, useful for zone automations, provably imprecise. For a real 3D point cloud of the room you’d swap in 60 GHz MIMO modules, and nothing you do with more LD2410s gets you there.
6. “Is mmWave the right tech for that?” #
gabe: Ok cool. Good to know. Is mm wave the right tech for something like that?
Hermes: Yes, with an important asterisk: mmWave is the right family, but the LD2410 is the wrong grade of it. The gap between “mmWave presence module” and “mmWave imaging radar” is bigger than the gap between either of them and a different technology.
Why mmWave is the right family for tag-free spatial sensing
It’s the only modality that is simultaneously no-tag, works in the dark, passes through drywall, plastic and clothing, and is privacy-preserving by construction: no image, no face, no identity. That’s why it’s installable in bedrooms and bathrooms where a camera isn’t.
Why the LD2410 specifically can’t do it
Two hardware numbers decide everything:
- Range resolution = c / 2B. The LD2410 sweeps 250 MHz, so 0.6 m theoretical, shipped as 0.75 m gates. That’s your ceiling, and no processing fixes it.
- Angular resolution is about wavelength over aperture. One antenna pair at 24 GHz (wavelength ~12.4 mm) with no array means no angle at all.
Now the same maths on a 60 GHz MIMO part (TI IWR6843 and its people-counting reference design):
- 4 GHz continuous bandwidth, 60-64 GHz: 8.4 cm range resolution
- 120 x 40 degree field of view, 3D point cloud with X/Y/Z plus radial velocity and SNR
- ±10 cm localization out to ~8 m, tracking multiple people
- 2 W of power consumption
That’s ~9x better ranging and full angular information in one step. The technology you’re picturing exists, is mature, and is what every commercial fall-detection and people-tracking product in eldercare is built on. It just isn’t the $5 module class.
Where mmWave is the wrong tool
- Identity. Radar can’t tell you from Erica; gait-id research exists but is lab-grade. Identity needs a phone/BLE/UWB tag or a camera.
- Battery. 80-90 mA at 5 V continuous for the cheap ones, 2 W for the 3D ones. PIR is microamps. The standard pattern is PIR as the wake trigger and the radar as the confirmer.
- Cheap room-level presence only. A $2 PIR or a $5 24 GHz module beats a $150 radar if all you need is “someone’s here”.
- Co-located 24 GHz units interfere with each other, another reason stacking LD2410s in one room is a dead end.
- 60 GHz cuts both ways: it attenuates much harder in drywall than 24 GHz. Bad for range, good for room confinement. Less “sees the neighbours”, which for you is probably a feature.
The honest alternatives, ranked
- Camera / depth: by far the most capability per dollar, pose, identity, everything. The cost is privacy; the middle path is on-device inference so no image ever leaves the house (OAK-D class hardware).
- WiFi CSI: the interesting one for you, because you already have the hardware. IEEE 802.11bf (WLAN sensing) was ratified in 2025, but there are no low-cost chips implementing it yet, so today’s DIY path is ESP32 CSI plus a classifier. That buys presence, motion and room-level, not a point cloud, and it’s zero new sensors across all rooms at once.
- UWB: centimetre-accurate 3D, but it needs tags. Great for phones, keys and cars, useless for tracking people who don’t carry anything.
- ToF arrays, thermal (32x24), ultrasonic: cheap 2.5D or coarse warm-blob tracking, short range, line-of-sight only. Fine as complements.
- Lidar: excellent 2D, but it sees legs, needs line of sight, has moving parts, and 3D gets expensive fast.
Verdict for your situation: your four LD2410s are the right tech for the job they’re actually doing (cheap, private, no-tag occupancy and rough zone awareness). For the 3D picture, the honest upgrade is one 60 GHz board, not more 24 GHz units, and even then you get a sparse scatter of dots that clusters into people-shaped blobs, not a photoreal room. If you ever want identity too, the pragmatic home stack is fusion: mmWave for spatial presence, PIR for instant motion, contacts on doors, phone/WiFi for identity, and a camera with on-device inference only where the payoff justifies it. No single sensor “sees the room” reliably, which is exactly why the commercial products that claim to are all 60 GHz and still only ship zone-level behaviour.
7. “Would a lazy Susan give me TV radar?” #
gabe: Just thinking out loud. Don’t implement anything. Would mounting one of these on a lazy Susan let me reproduce something like radars you see on tv…with little blips identifying objects and their range (within a gate)?
Hermes: Yes, and you’ve just independently reinvented mechanically scanned radar. That’s exactly how marine, ATC and WWII radar work: one narrow beam on a rotating mount, and the TV look is a PPI display, sweep line, phosphor afterglow, blips at range and bearing. So the concept is sound. Whether it looks right comes down to three numbers.
Yours vs a real one
Marine X-band radar: ~1-2 degree beam from a 4-6 ft slotted-waveguide, 24 RPM, range resolution set by pulse length (tens of metres). The antenna alone costs more than a whole house of these sensors.
LD2410 on a lazy Susan: wide detection cone, single antenna, 0.75 m range gates. So your range axis is honestly better than a marine radar (0.75 m versus tens of metres), and your bearing axis is 10-100x worse.
Bearing is the whole ballgame. Bearing resolution can never be finer than the beamwidth. With a beam tens of degrees wide, sweeping it around 360 degrees gives you roughly 6-12 fat sectors, so targets come out as arcs, not dots. Unless the beam is narrowed, the display will look like radar seen through frosted glass.
Spin rate is not the limit, I measured it. The LD2410 produces a new frame about 6 times per second (median 161 ms between changes; 375 request/response round trips in 20 s to check). So:
- 6 RPM (10 s/rev) is 5.8 degrees per new frame
- 12 RPM is 11.6 degrees per frame
- 24 RPM, marine speed, is 23 degrees per frame
All finer than the beamwidth, which means you can spin slowly and waste nothing. The sensor can’t keep up with a fast spin anyway, so there’s no benefit to spinning faster than the beam can be filled.
The clutter map is the prize. The LD2410’s static channel is amplitude-based, not Doppler-gated, so a rotating beam sweeps the room and registers walls, furniture and doorframes as bright arcs. You’d literally draw a crude floor plan of the room. That’s the part that would genuinely look like the TV radar: fixed structure plus your blips moving against it.
Two traps worth thinking about
- Off-centre mounting fabricates motion. If the module sits r off the rotation axis, its phase centre translates at omega times r, and that’s real Doppler. At 60 RPM with a 5 cm offset: 0.31 m/s, about a 50 Hz shift at 24 GHz, straight into the human-motion band. Even at 6 RPM it’s ~5 Hz, comparable to slow human movement. So the module has to be centred on the axis, or you compensate the apparent velocity out. A well-centred lazy Susan has no such problem.
- Motion blur on the “moving” channel. A person walking is only inside a narrow beam for the time it takes to sweep past, so moving targets flash rather than sit. That’s exactly why real radars use afterglow persistence on the display, and your renderer would need the same phosphor-decay trick to make it readable.
If you wanted it to actually look right, the single highest-leverage change isn’t the motor, it’s narrowing the beam. A metal horn or a slotted shield around the module would take it from tens of degrees to maybe 15-20 degrees, and that’s the difference between arcs and blips. Bearing then becomes meaningful.
But here’s the honest comparison: a 60 GHz MIMO board does an electronically scanned 120 degree sector in ~10-15 degree azimuth bins with no moving parts, at 10 Hz. Three of them cover 360 degrees with better resolution than any turntable you’d build, and no slip ring, no encoder sync, no Doppler artefact. So as a product idea, spinning loses on every axis except cost and charm.
As a hobby idea it’s great, and it has a real second use: a turntable is a legitimate instrument for characterising the module’s actual beam pattern and finding the multipath ghosts in your specific rooms. Spin it once and see exactly where your LD2410s really look and where they lie to you. That’s worth more than the display.
gabe: Yeah just as a fun project to build that’s all. And really just thinking about it, I probably wouldn’t ever find the time to actually do it!
Hermes: Ha, that’s the honest fate of most shop projects. The good news is the fun part doesn’t need the motor: the beam-pattern and ghost-hunting experiment works just as well if you rotate a sensor by hand and watch the live view, or leave it in four fixed orientations. Which is roughly what the four units already do across rooms.
I’ve folded the useful bits into the
roomsense-iq-firmwareskill so none of it has to be re-derived later: the/wsplusdata_requestprotocol, the ~6 frames/s ceiling, the fact that those 18 gate discovery structs exist but were never wired up, and the “MQTT socket alive but HTTP dead” signature.
Outcome, in one place #
- Live dashboard: http://192.168.1.6:8765/, built as
radar-live.py(stdlib only: poller plus SSE server on the Pi, canvas in the browser), installed as a systemd user service so it survives reboot. - Snapshot tool:
radar-view.py, one 60 s waterfall PNG plus a profile log per room, written into~/room-sense/. - Cost: ~220 ms of CPU over the first 8 s, four tiny websocket sessions. Home Assistant, MQTT and Prometheus are untouched.
- What it does not do: no point cloud, no angle, no 2D position. The LD2410 gives energy per range gate along a single beam, and that is all it will ever give.
- Two firmware findings that came out of this: the 18 gate discovery structs (
macro_move_bin0..8,micro_move_bin0..8) exist with working serializers but are never published, and the 5 Hz QoS 2 presence topic is 99% of each unit’s MQTT traffic. - Measured, not assumed: the LD2410 emits a new frame about 6 times per second (median 161 ms), which is what makes a mechanically scanned version of this idea pointless.
- Deliberately not built: the MQTT firmware patch for the gate profiles, the Grafana heatmap dashboard, 2D multilateration, and anything 3D. The 2D and 3D sections were hypotheticals, and the turntable idea was declined before any code.
- Loose end at the time: the Foyer unit was wedged (MQTT socket open, HTTP dead) and needed a power-cycle.