
I have 6 OpenBSD machines that I use for self hosting various services:
- nuc - My main homeserver, hosts general stuff that I use at home.
- bluebox - My home router, what connects me to the internet.
- www - A VPS that hosts this website.
- smtp - A VPS that hosts my mail server.
- imap - A VPS that serves my mail clients.
- vpn - A VPS that I use as a VPN exit node when I need to.
Right now, if something goes wrong on one of those servers, or if I want to see
something in their log files, I need to ssh into them and start tailing things
manually. This is mostly fine, as it’s not something I need to do very
frequently, but it is something that every time I do it I’m like “there must be
a better way.” That’s not really what I think, what I really think is “I kinda
sorta want to play around with getting all my logs aggregated in a single place
because I like playing with things and this feels like it could be fun to
setup.”
I already have centralized metrics via Prometheus and
Grafana and I know that grafana has a newish logging
platform called Loki that’s integrated
into their existing ecosystem. I’ve been wanting to play with that for awhile (I
installed it on my main homeserver over a year ago) so I figured I’d take some
time to get it up and running.
I’ve heard good things about
VictoriaLogs as another
option for centralizing your logs but since I already had the grafana stack in
place I decided to stick with that for now.
Loki was already installed, so I didn’t need to do that, but for reference:
doas pkg_add loki
rcctl enable loki
rcctl start loki
There were a few errors starting up, maybe because I installed it quite a while ago but never got around to using it? I run OpenBSD snapshots on this machine so packages change more frequently that when you’re on a release.
For whatever reason, I was seeing the following errors when attempting to start Loki:
loki[10661]: failed parsing config: /etc/loki/loki-config.yaml: yaml: unmarshal
errors:
loki[10661]:   line 54: field enable_multi_variant_queries not found in type
logql.EngineOpts. Use `-config.expand-env=true` flag if you want to expand
environment variables in your config file
It turns out the enable_multi_variant_queries configuration item was in the
wrong section of my config file. I moved it to the correct place and then the
daemon started properly. I also noticed that the log level for loki was set to
debug, so I switched it to info so that it wouldn’t spam my local logs.
Here’s my full /etc/loki-config.yaml for reference:
auth_enabled: false

server:
  http_listen_port: 3100
  grpc_listen_port: 9096
  log_level: info
  grpc_server_max_concurrent_streams: 1000

common:
  instance_addr: 127.0.0.1
  path_prefix: /var/loki
  storage:
    filesystem:
      chunks_directory: /var/loki/chunks
      rules_directory: /var/loki/rules
  replication_factor: 1
  ring:
    kvstore:
      store: inmemory

query_range:
  results_cache:
    cache:
      embedded_cache:
        enabled: true
        max_size_mb: 100

limits_config:
  metric_aggregation_enabled: true
  enable_multi_variant_queries: true

schema_config:
  configs:
    - from: 2020-10-24
      store: tsdb
      object_store: filesystem
      schema: v13
      index:
        prefix: index_
        period: 24h

pattern_ingester:
  enabled: true
  metric_aggregation:
    loki_address: localhost:3100

ruler:
  alertmanager_url: http://localhost:9093

frontend:
  encoding: protobuf

querier:
  engine:
Now that the server was running, I needed to ship some logs to it. I decided to
start with my home router, as I had just been having issues with it (something
to do with my ISPs move to CGNAT) and it would have been handy to have the logs
in grafana so I could more easily coordinate timestamps with the network
connectivity drops I had been seeing.
The router is also on the same network as the homeserver so that should make setup and debugging easier if needed.
Grafana recommends using
alloy as both log
shipper and to replace node_exporter for metrics scraping. I currently have
node_exporter in place, so for now I’m only using the log shipping
functionality in alloy. Removing node_exporter will be left as a TODO for
another day.
I sshed to my router, and added the package:
pkg_add alloyThen I edited the /etc/config.alloy file to match my setup:
logging {
        level  = "info"
        format = "logfmt"
}

local.file_match "syslog" {
  path_targets = [
    { __address__ = "localhost", __path__ = "/var/log/messages", job = "syslog", log_file = "messages", host = "bluebox" },
    { __address__ = "localhost", __path__ = "/var/log/daemon",   job = "syslog", log_file = "daemon",   host = "bluebox" },
    { __address__ = "localhost", __path__ = "/var/log/authlog",  job = "syslog", log_file = "authlog",  host = "bluebox" },
  ]
}

loki.source.file "syslog" {
  targets    = local.file_match.syslog.targets
  forward_to = [loki.write.default.receiver]
}

loki.write "default" {
  endpoint {
    url = "http://192.168.1.10:3100/loki/api/v1/push"
  }
}
I needed to change the permissions on the /var/log/authlog, and
/var/log/daemon files as they are only readable by root:wheel by default on
OpenBSD. I changed their group to _loki (the user that the alloy daemon runs
as) and updated the /etc/newsyslog.conf file so that those permissions would
persist when logs are rotated.
chgrp _loki /var/log/authlog /var/log/daemonHere’s the newsyslog.conf after changes:
#       $OpenBSD: newsyslog.conf,v 1.38 2022/01/05 18:34:23 deraadt Exp $
#
# configuration file for newsyslog
#
# logfile_name          owner:group     mode count size when  flags
/var/cron/log           root:wheel      600  3     10   *     Z
/var/log/authlog        root:_loki      640  7     *    168   Z
/var/log/daemon         root:_loki      640  5     300  *     Z
/var/log/lpd-errs                       640  7     10   *     Z
/var/log/maillog                        640  7     *    24    Z
/var/log/messages                       644  5     300  *     Z
/var/log/secure                         600  7     *    168   Z
/var/log/wtmp                           644  7     *    $M1D4 B ""
/var/log/xferlog                        640  7     250  *     Z
/var/log/pflog                          600  3     250  *     ZB "pkill -HUP -u root -U root -t - -x pflogd"
/var/www/logs/access.log                644  4     *    $W0   Z "pkill -USR1 -u root -U root -x httpd"
/var/www/logs/error.log                 644  7     250  *     Z "pkill -USR1 -u root -U root -x httpd"
By changing the group of these logs to _loki I could ensure that the alloy
daemon would be able to read and ship these logs to my homeserver. It also meant
that I could keep the permissions set to 640 so that only owner and group can
read them.
Once that was done, enable and start the daemon:
rcctl enable alloy
rcctl start alloy
The daemon started up without any errors, however I still wasn’t seeing any logs in the Grafana UI.
I manually validated that loki was running and reachable from the router
(bluebox):
bluebox# ftp -M -o - http://192.168.1.10:3100/ready
Trying 192.168.1.10...
Requesting http://192.168.1.10:3100/ready
ready
6 bytes received in 0.00 seconds (28.70 KB/s)
That looked fine, so I checked to make sure there were logs being ingested on
the loki side of things (on the homeserver, nuc):
$ curl -s http://localhost:3100/metrics | grep
loki_distributor_lines_received_total
# HELP loki_distributor_lines_received_total The total number of lines received
per tenant
# TYPE loki_distributor_lines_received_total counter
loki_distributor_lines_received_total{aggregated_metric="false",policy="",tenant="fake"}
254
loki_distributor_lines_received_total{aggregated_metric="true",policy="",tenant="fake"}
16
That’s showing me that log lines are making it to nuc, they’re just
not showing up in the UI.
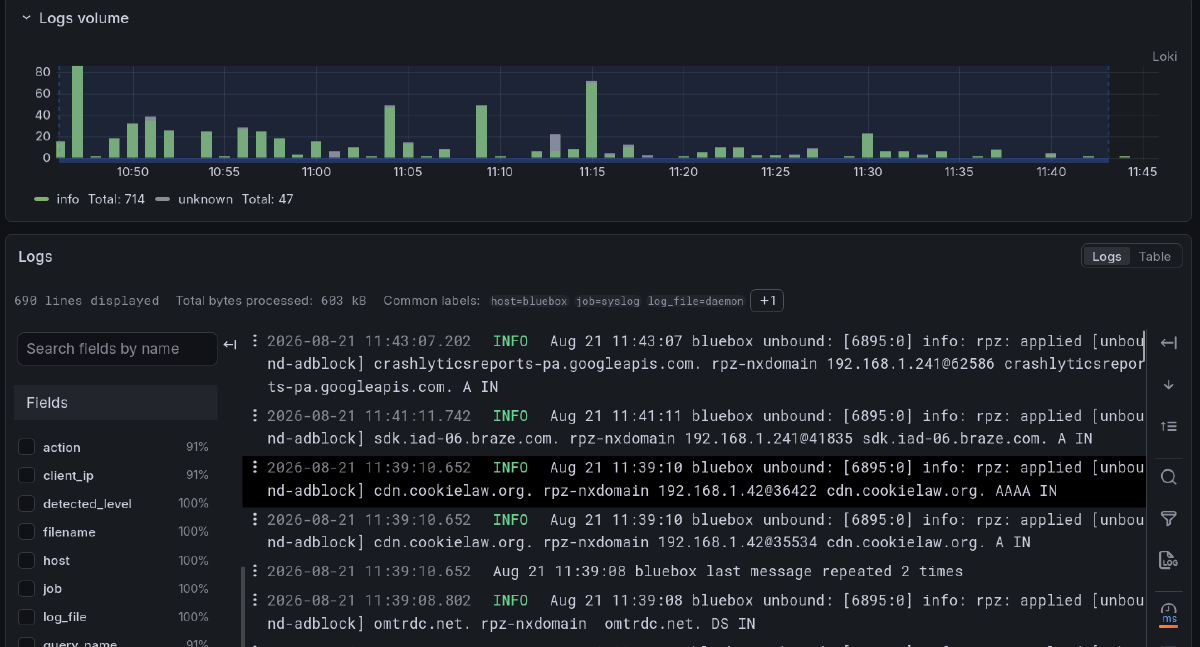
I went back to the Loki UI and clicked around a bit, and saw a message saying
that the loki plugin wasn’t properly configured. This lead me to double check
the plugin settings, and sure enough, I had forgotten to enter the connection
URL: http://localhost:3100/. Once I put that in, and saved it, I started
seeing my logs!
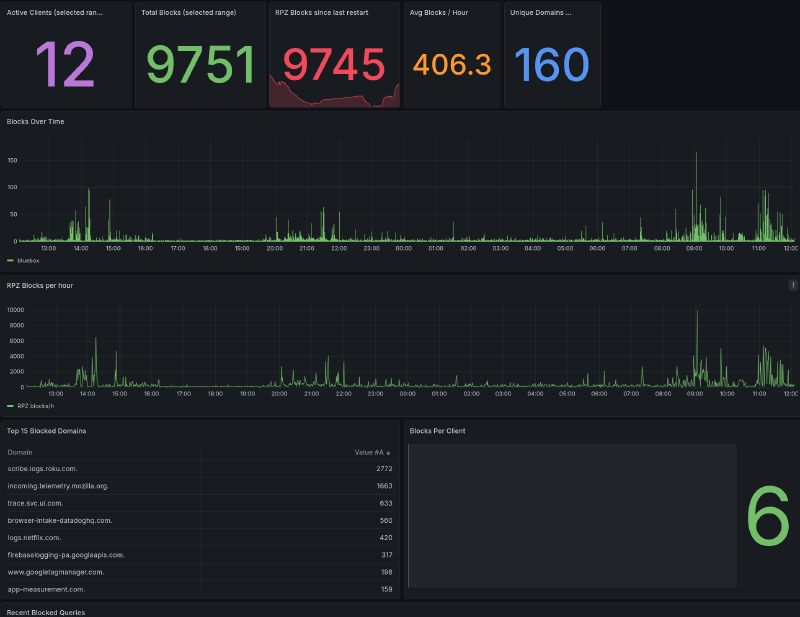
As a bonus, I asked Claude to help me extract some information out of my
unbound-adblock logs since I
didn’t currently have much insight into what is being blocked, or how much it
was being used. Claude helped me parse the unbound-adblock specific logs out of
the log stream and built me a grafana dashboard so I can see what’s going on:
Thanks Claude.
Next step, deploy alloy on the remaining OpenBSD servers.